Local marketing
Metrics for measuring print marketing campaigns
Response rate, conversion rate, cost per response, and more. A guide to the KPIs used to evaluate leaflet and flyer campaigns.
- Author
- flyerfly team
- Published
- Reading time
- 5 min read
With so much focus on online advertising, print can look hard to evaluate. In practice, a handful of metrics covers most leaflet and flyer campaigns, especially for businesses serving one town or a small set of postcodes.
Below are the KPIs commonly used to assess print marketing performance, with notes on how local businesses can apply them without a large analytics team.
Response rate
Response rate measures how many recipients responded to the call to action on your print material. That response might be a phone call, a walk-in, a completed form, a purchase, or a visit to a campaign page.
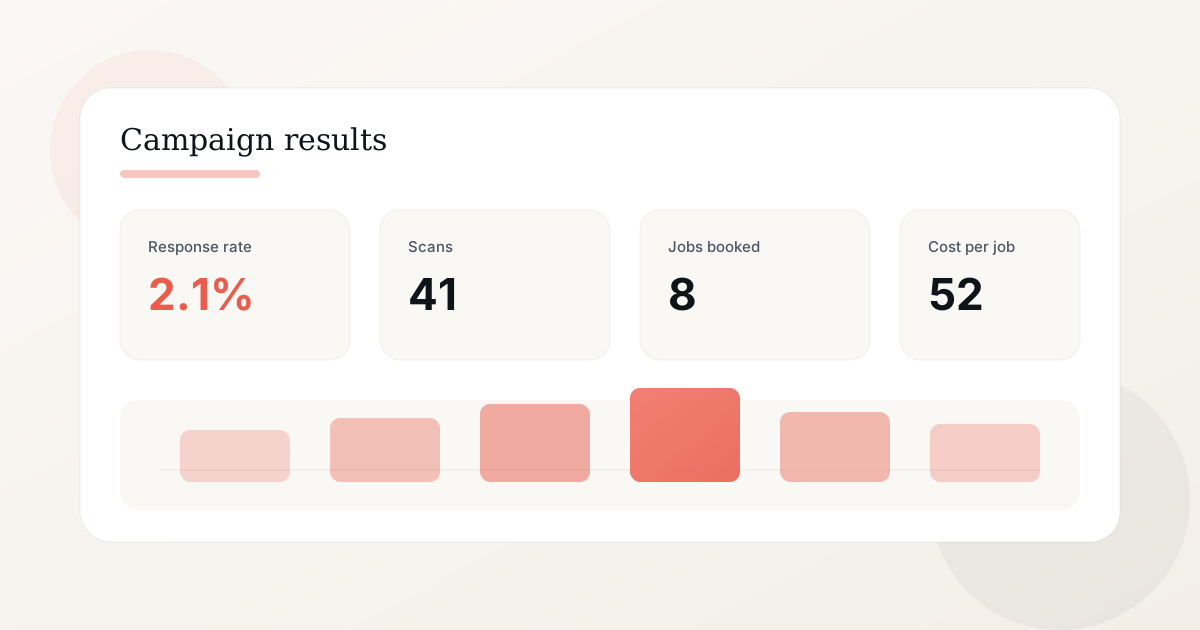
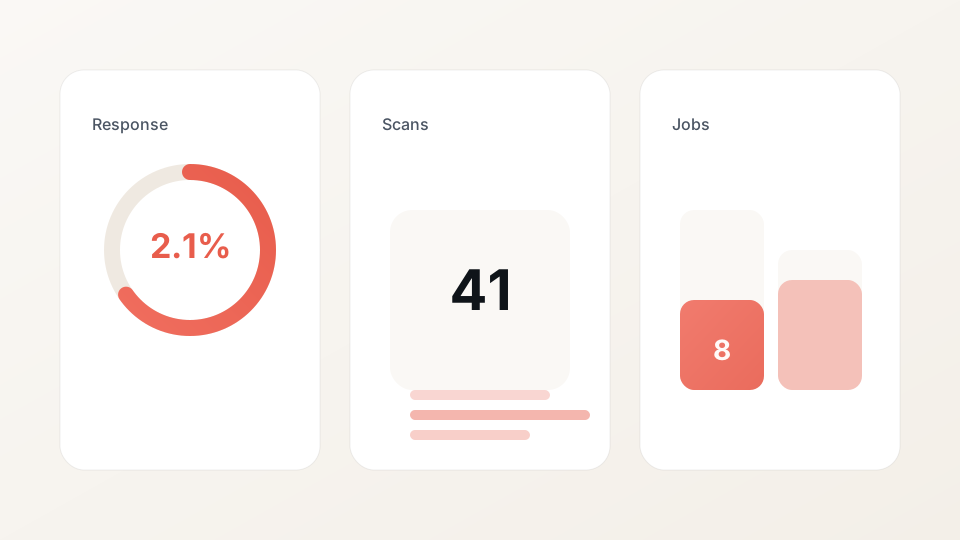
To calculate response rate, divide the number of responses by the number of pieces delivered or households reached. Example: forty calls from two thousand leaflets is a two percent response rate.
Response rate is often the first number owners watch after a drop. It shows whether the message and area generated any action at all.
Conversion rate
Conversion rate is how many responses became the outcome you wanted: a sale, booking, sign-up, or appointment.
If forty people called and eight booked a job, your conversion rate from enquiry to job is twenty percent for that batch. If plenty of people called but few booked, check your offer and follow-up. If few people called at all, check the headline and area.
A cheap service (a €15 haircut) may convert after a handful of calls or website visits from the leaflet. A more expensive service (a kitchen refit, a new roof) may need many more calls or visits before someone books. Wait longer before you judge those batches.
Cost per response
Cost per response divides total campaign cost by the number of responses.
Example: €420 spent on design, print, and delivery, with thirty-five responses, gives a cost per response of about €12. Use this figure to compare print with other channels in the same month.
Customer lifetime value
Customer lifetime value (CLV) estimates the total revenue a customer will generate over time. It is not unique to print, but it shows whether customers from a leaflet run are worth the cost of printing again.
If customers normally come back (haircuts, gym sessions, dental check-ups), note whether leaflet customers rebook within a year. A simple rebook count is usually enough for local campaigns.
Brand recognition
Flyers, brochures, business cards, and leaflets build familiarity when used consistently. Brand recognition is harder to isolate in a spreadsheet than calls or sales.
Watch for branded search lifting after a drop, or customers mentioning they saw your print. Record those notes in the batch row as supporting context.
Online visit counts
If you add a QR code to your print (the square barcode people scan with their phone camera), you need a separate tracked link per batch. flyerfly counts visits per run so you can log them beside your call data. Visits often show up on day one or two, before you have logged all the phone calls from that drop.
This is optional. Many campaigns rely on phone and promo codes alone. If you do add a scannable link, test a printed proof before the full run and match the landing page headline to the leaflet.
Coupon redemption
If your print includes a coupon or offer code, redemption rate shows how many people used it. This works well when checkout or phone staff log codes consistently.
Use unique codes per campaign when you can. Log redemptions in the same batch row as your other response data.
Website traffic
Print can send people to your website. A traffic spike after a drop is a good sign, but your general website stats will not tell you which leaflet batch caused it.
A landing page set up for one batch is easier to link back to that leaflet than your general homepage traffic.
Customer feedback
Surveys, short questions at booking, and informal comments help explain why numbers moved. Ask whether the leaflet influenced the decision to call or visit.
Use feedback alongside your numbers. It explains why a batch did well or poorly.
Social media engagement
Social handles or campaign hashtags on print can bring mentions and shares. Track them if social is part of your plan. For most local service businesses, calls and bookings matter more.
Sales revenue
Sales revenue is the bottom-line number for many campaigns. Log revenue against the batch when you can, even if you have to estimate.
Compare revenue to batch cost to see whether the run paid for itself. You will not always know which customer came from which leaflet, but rough numbers are still enough to decide whether to print again.
Putting the metrics together
You do not need every KPI on every drop. A workable starting set for local print:
| Metric | What it tells you |
|---|---|
| Batch cost | What you spent |
| Tagged enquiries | Calls and walk-ins from the run |
| Jobs booked | Revenue-linked outcome |
| Cost per job | Whether the batch paid for itself |
Related reading
FAQ
Response rate is the percentage of people who took action after receiving your print, such as calling, visiting, filling in a form, or using an offer code. Divide responses by households reached or leaflets delivered.
Response rate measures initial action. Conversion rate measures how many of those responses became the outcome you wanted, such as a booked job, sale, or appointment.
Divide the total cost of the print campaign, including design, print, and distribution, by the number of responses you received.
Yes, if you add a way to reach your offer page from the print, such as a QR code with a tracked link. Visits often show up within a day or two of a drop, before you have logged all the phone calls.
Start with batch cost, tagged enquiries, and booked jobs. Add response rate and cost per job once those basics are routine.
Related articles
How to measure the results of print marketing
How to see whether your leaflets and flyers brought calls, enquiries, and booked work. A practical guide to measuring print campaigns for local businesses.
Read articleHow to A/B test two leaflet offers without guessing
Split areas, split QR links, compare scans and calls. A practical way to learn which headline wins before you reprint thousands.
Read articleSEO, social ads, and leaflets: a local marketing stack for small budgets
You do not need enterprise software to combine search, social, and print. Here is a realistic stack for businesses watching every euro.
Read article